Scaling plots near the Mott transition

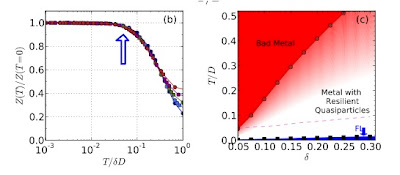
Earlier this year Jure Kokalj brought to my attention an interesting PRL Quantum Critical Transport near the Mott Transition by H. Terletska, J. Vučičević, Darko Tanasković, and Vlad Dobrosavljević. My interest in this paper increased this week when Vlad emailed me to tell me about a recent talk at KITP by Kazushi Kanoda. The right side of the slide below [click on it to see it larger] shows a scaling analysis of the temperature and pressure dependence of the resistivity of the organic charge transfer salt kappa-(ET)2(CN)3 near the pressure driven Mott transition. This scaling analysis is based on the theory in the PRL. The left side shows the Dynamical Mean-Field Theory (DMFT) results [for a Hubbard model at half filling] in the PRL. The top shows the scaling of the resistivity curves and the bottom the T vs. U phase diagram where the yellow region is the "quantum critical" region above the Mott transition. It is striking that the experimental curves involve sc